Heat Map Generator Tool – Type 1 (Normal Heat map)
Description
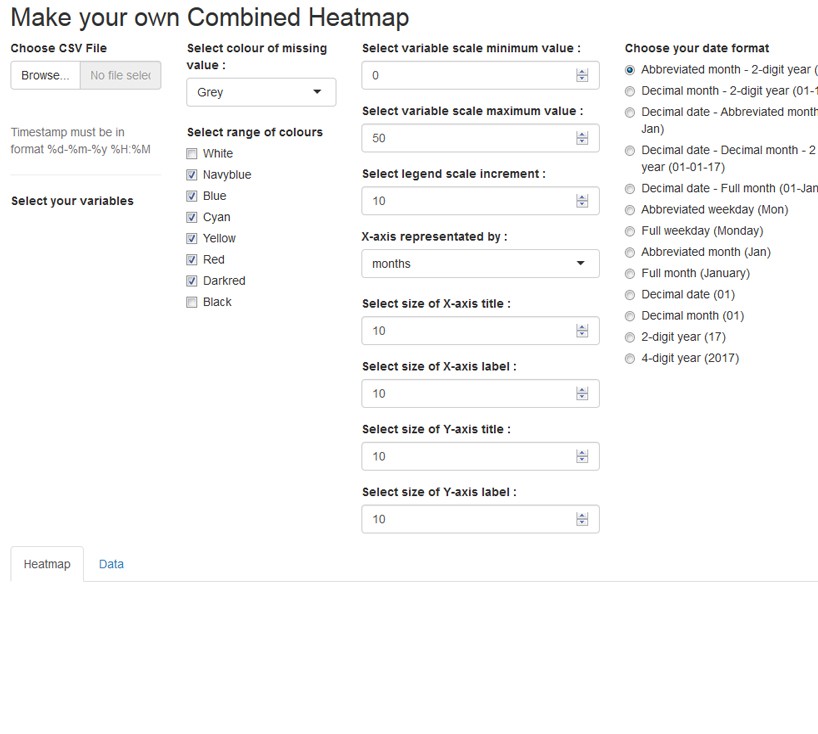
Centre for Advanced Research in Building Science and Energy (CARBSE) at CEPT University has developed two tools to generate heat maps. This is a free tool. The objective of this tool is to help visualize Building Energy Simulation output in more meaningful manner. Salient features are: • Choices of colours to make the heat map including separate colour provision for missing value. • Choice of different date formats that best suits the timeline. • Choice to alter the range of numbers to be included in the heat map by adjusting variable scale options. • Provision to enter the title, X-axis, Y-axis and legend label name. To use this tool the user’s input CSV file should have: • A column with exact header as “Timestamp”. • The format of Timestamp should be “decimal date – decimal month – 2 digit year Hours:Minutes”, for example “01-01-17 17:30” that represents 1st January 2017 at 17 hours and 30 minutes. • Other columns of the input file must contain numerical value and blank cell for missing values. Heat map Type-1 (Normal Heat Map) helps in visualising any one variable at a time which are listed in the input CSV file. The tool can also add a constant time band using upper and lower limit values. The user can dynamically navigate to see the behaviour of other variable from the drop-down menu available. User can download output from this tool as *.PNG file. The tool is output of project titled US India Joint Centre for Building Energy Research and Development (CBERD) sponsored by The U.S. Department of Energy (DOE) and the Department of Science and Technology (DST), Government of India.