How do you utilize utility bill data to guide retrofit projects?
-Bill Overload
Dear Bill Overload,
Retrofit analysis uses historic utility bill data (consumption, demand, and cost) to inform a utility efficiency project’s design strategy. Utility bill data can be compiled into a broad overview of a building’s energy usage, giving modelers an idea of what to expect from their more detailed models. It sets expectations for future demand and can also reveal trends. The anticipated changes that a project will make to the monthly or annual utility bills serve as a metric for the project performance.
Another use for historical utility data is to calibrate simulation results that are initially approximate to have a finer resolution. Daily and hourly trends can be scaled from the billed monthly usage or metered data to create a more detailed energy model. Demand data can be used to quantify short-term peak performance for electricity use. This is especially useful for determining equipment sizes for peak usage.
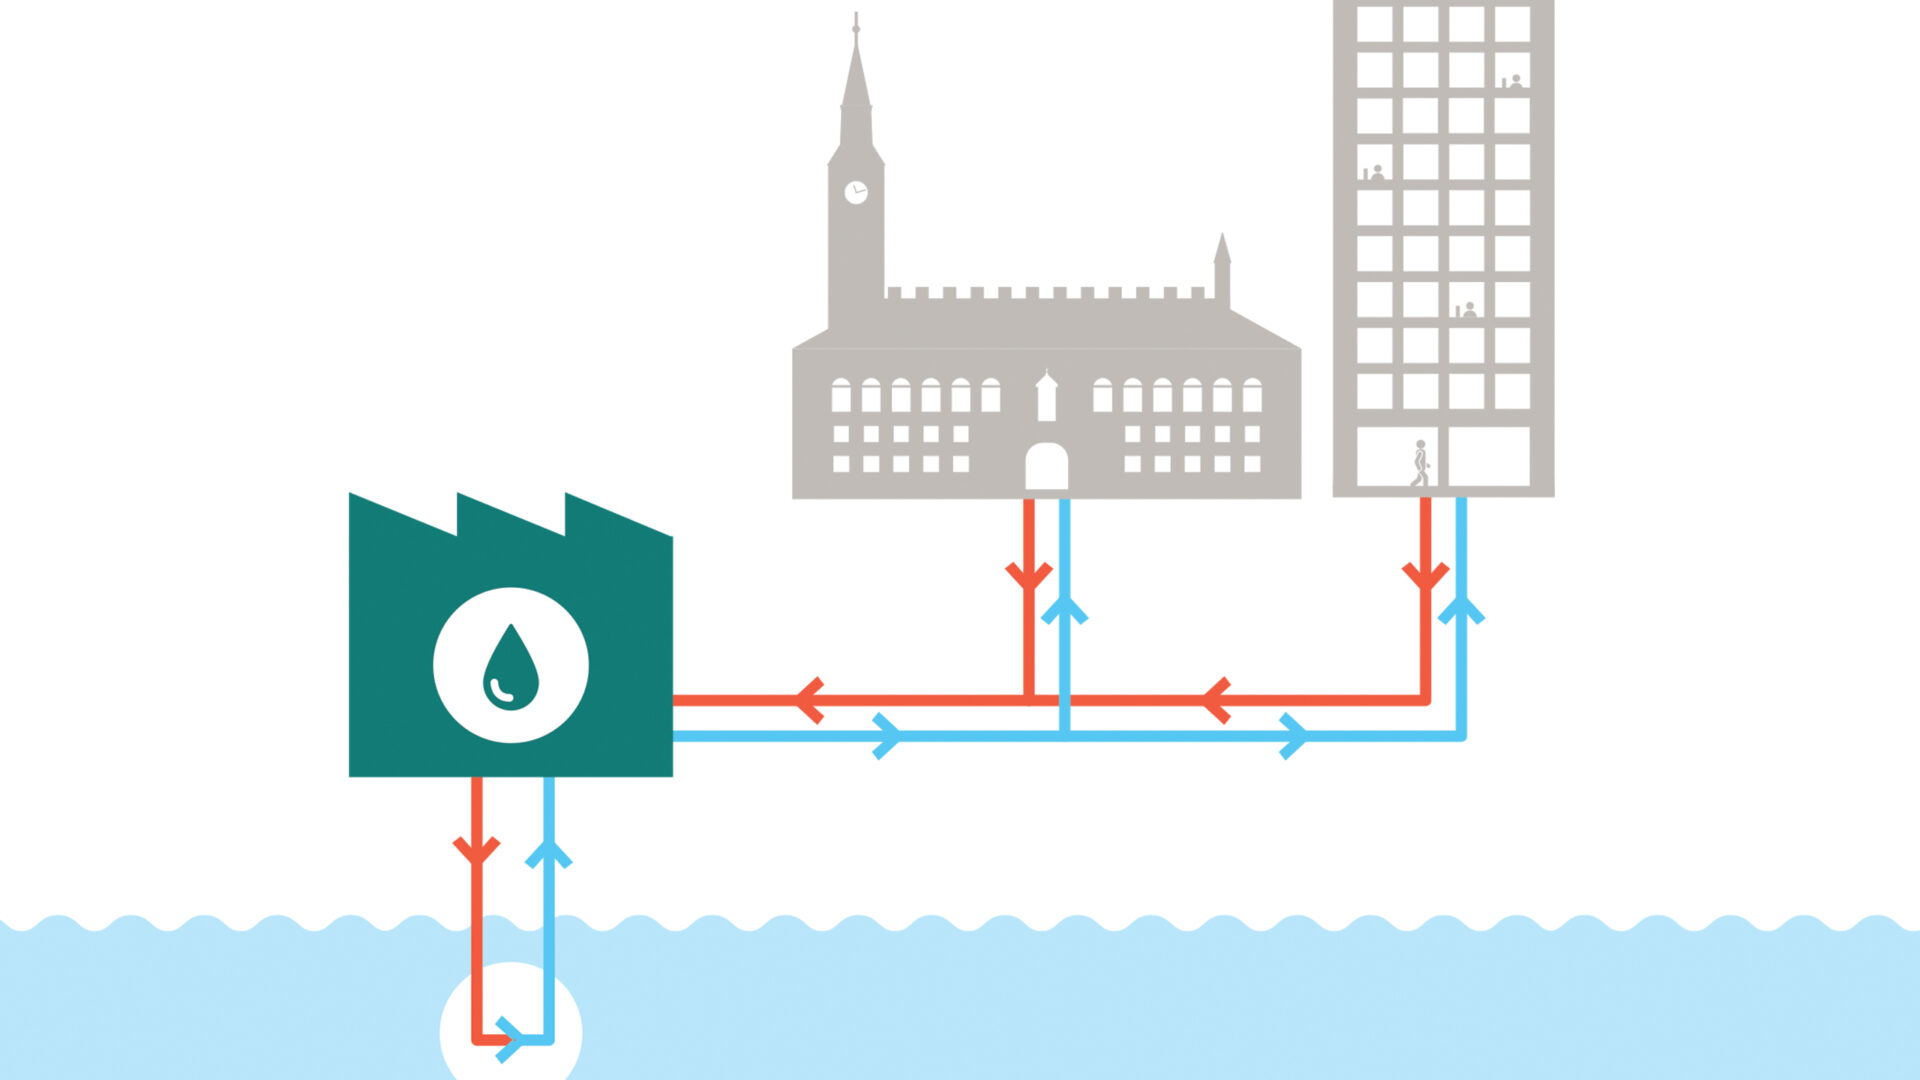
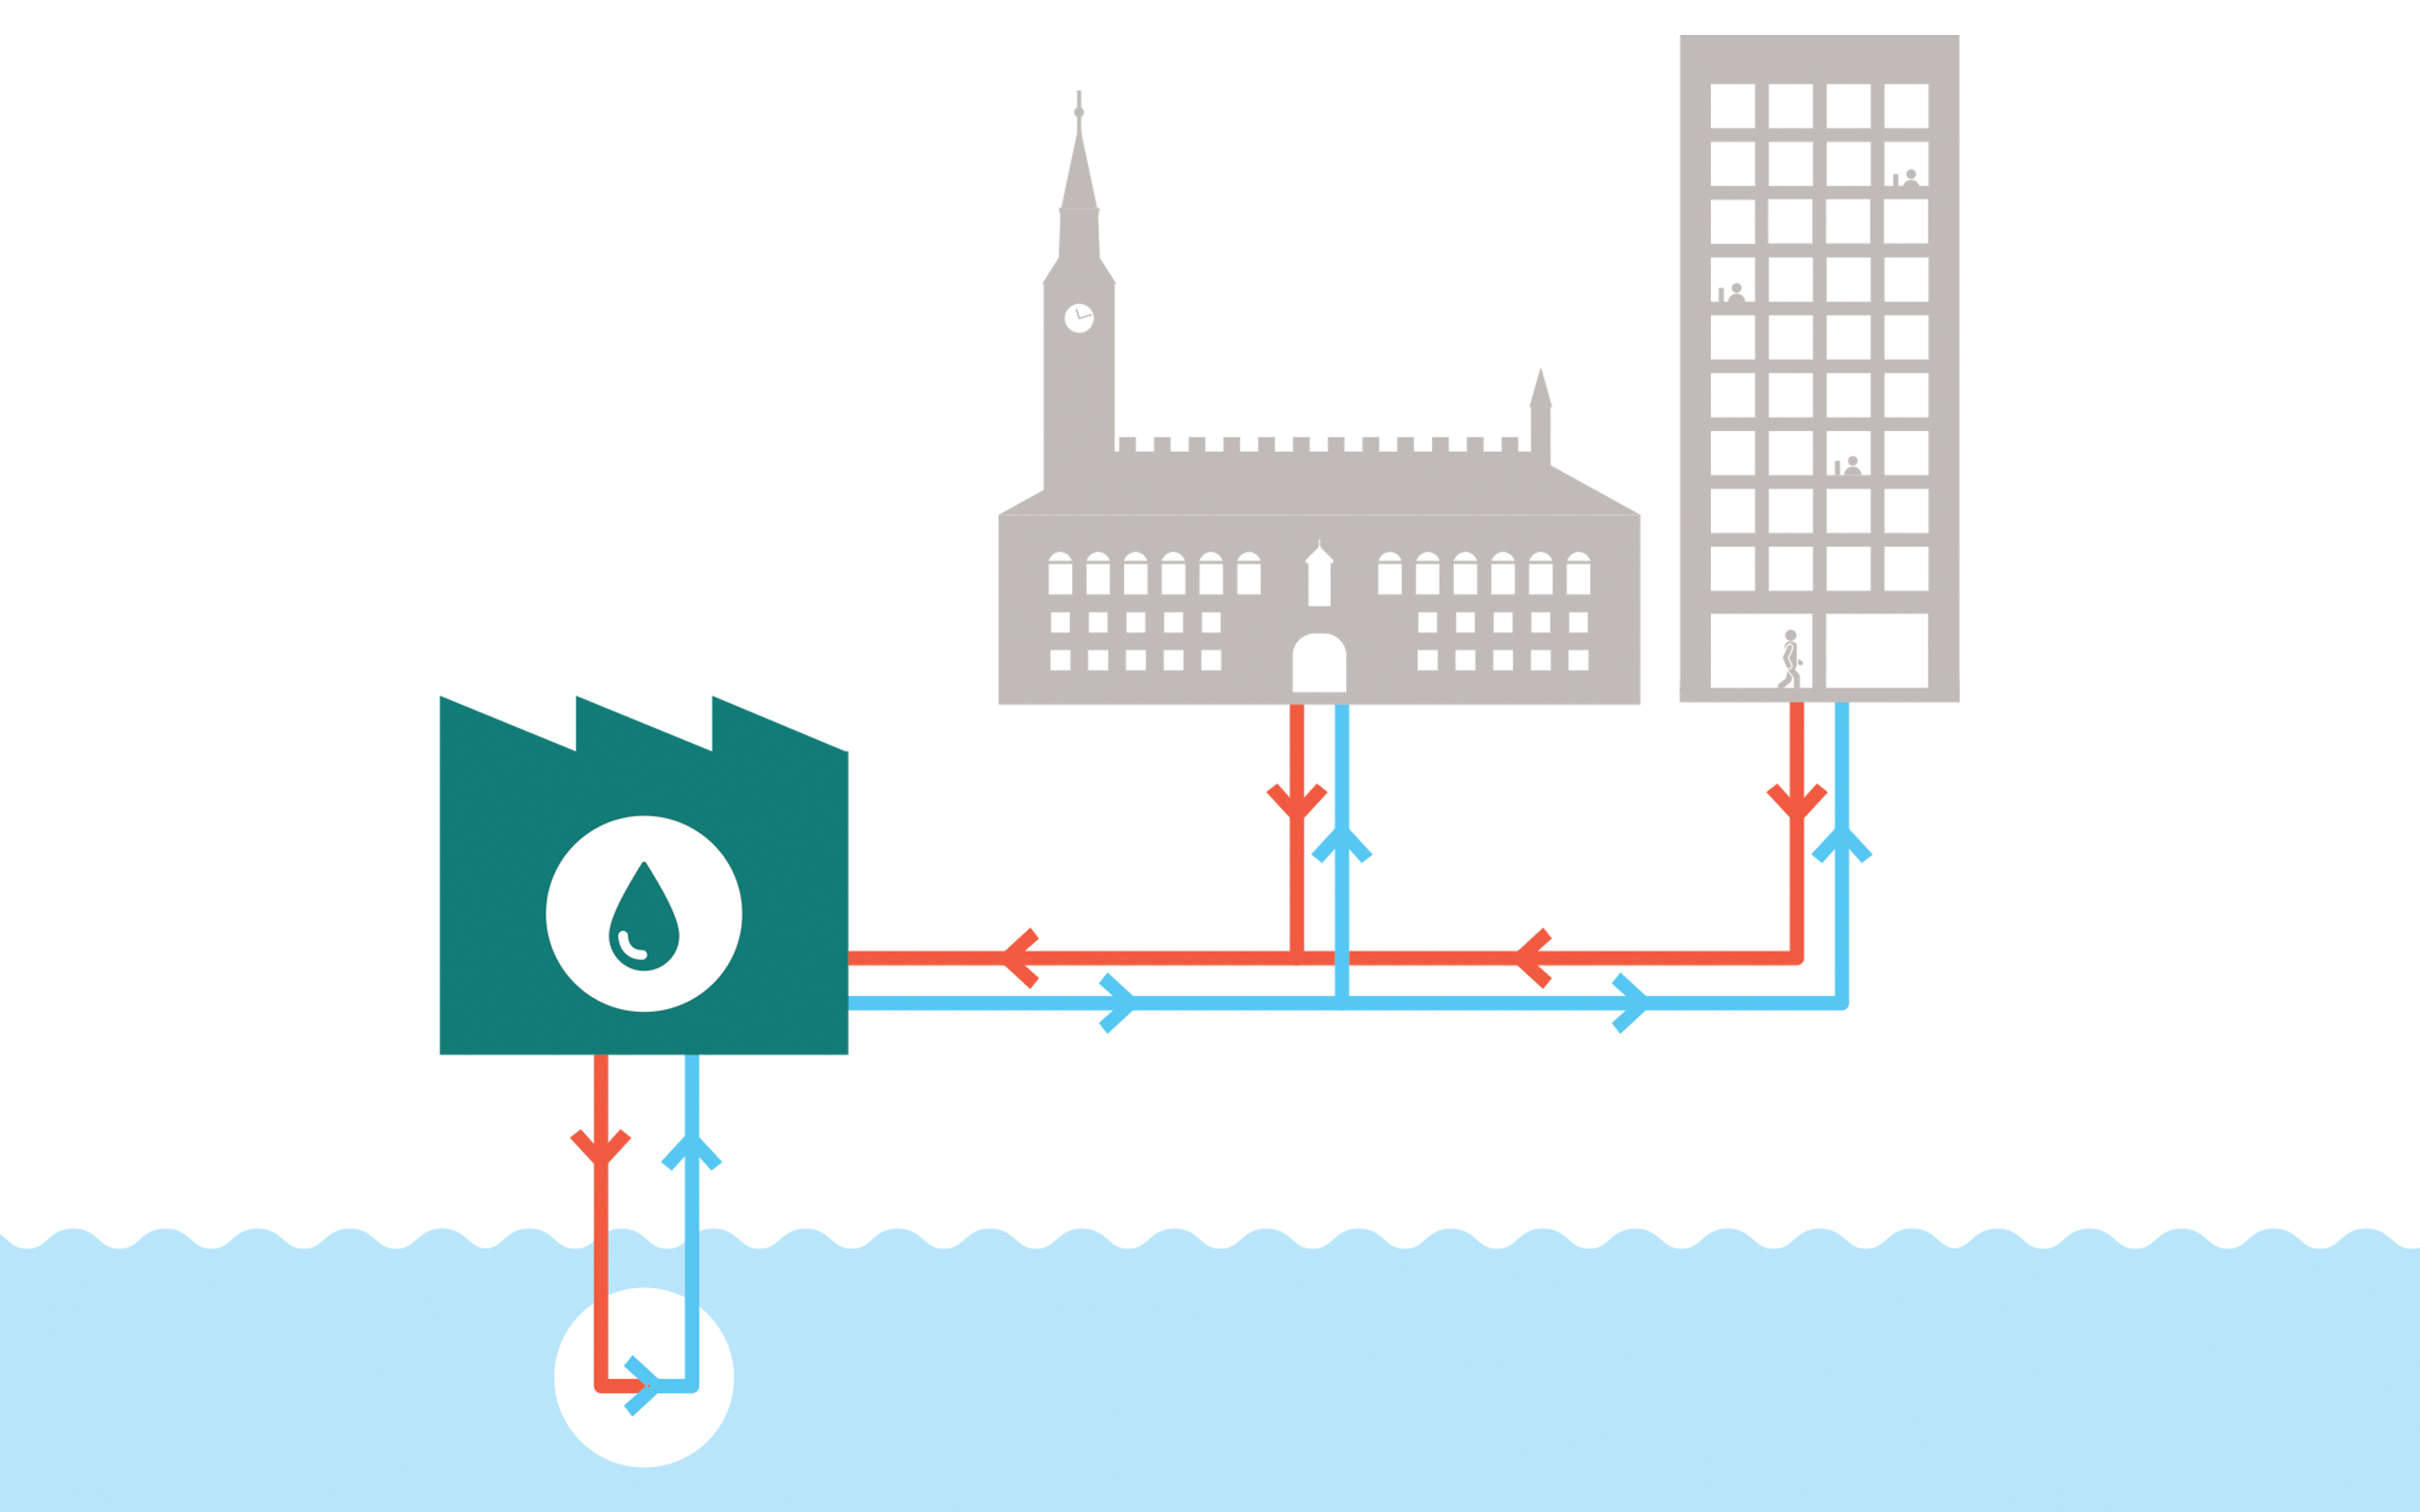
A recent case study illustrating these uses of utility bill data for a retrofit analysis is a water conservation project that will change the make-up water source for the cooling towers at three GSA office buildings in Atlanta, Georgia: Sam Nunn (Nunn), Richard B. Russell (RBR), and Martin Luther King (MLK). The project goal was to provide at least 90% of cooling tower make-up water to the three buildings using groundwater flowing into the Nunn building’s sub-foundation. Using groundwater reduces the cost associated with purchasing city water.
Monthly water bills and submeter data were used to create an initial demand model. We used data from 2019 because it best represents activity outside the pandemic. A supply model was created using spot measurements of the aquifer’s flow rate. Comparing the supply with the demand revealed that the existing aquifer would not be able to meet the 90% goal, but it also showed that investments in other groundwater sources such as wells were viable, allowing the project to move forward.
The monthly usage was combined with the Nunn building’s daily make-up water readings and the results of an energy simulation to refine the model further. The daily usage data at the RBR and MLK buildings was estimated by scaling down Nunn’s to match their respective monthly usage. Hourly profiles were taken from the simulation by determining what percentage of a given day’s demand was used in each hour. In this way, profiles of each building were created for weekdays and weekends of each month. These profiles were normalized by each day’s usage and strung together to create an hourly model across the year for each building.
The energy simulation also was helpful in identifying suspect meter data. Several of the RBR and MLK buildings’ meter readings were unrealistically low or high for buildings their size, especially when compared to the Nunn building’s. Like the hourly data, Nunn’s monthly usage was used for the other two buildings, but scaled down proportionally as given by the simulation. This gave us the most believable demand model for all three buildings.
The retrofit analysis was performed by comparing the hourly water supply to the hourly demand. Figure 1 shows the results of this analysis for one day at MLK. In addition to showing whether a given day can be fully supplied by groundwater, the analysis also facilitated maximum peak flow calculations, which were used to size equipment and piping.
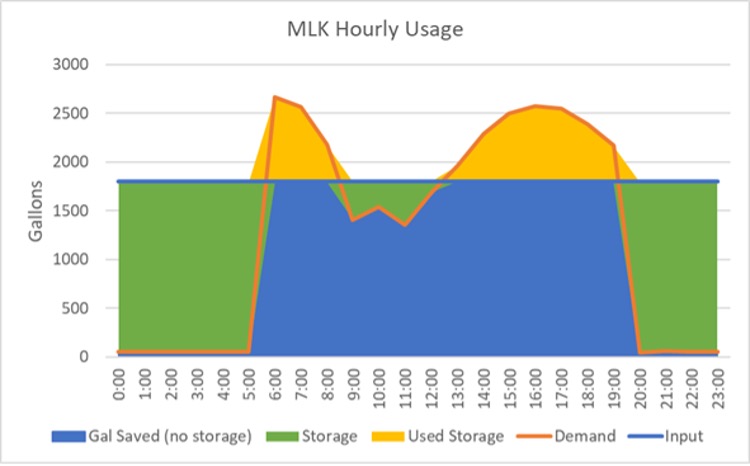
Figure 1. Example hourly cooling tower make-up water usage and savings for MLK on September 25th, 2019. City water would not be needed on this day because the combination of groundwater supply and storage is greater than the demand.
The complete make-up water replacement model of all three buildings together over the whole year is shown in Figure 2. The retrofit analysis indicated that, with the aforementioned investment into additional groundwater sources, 94% of annual water consumption will be provided by groundwater, which is comfortably over the 90% objective.
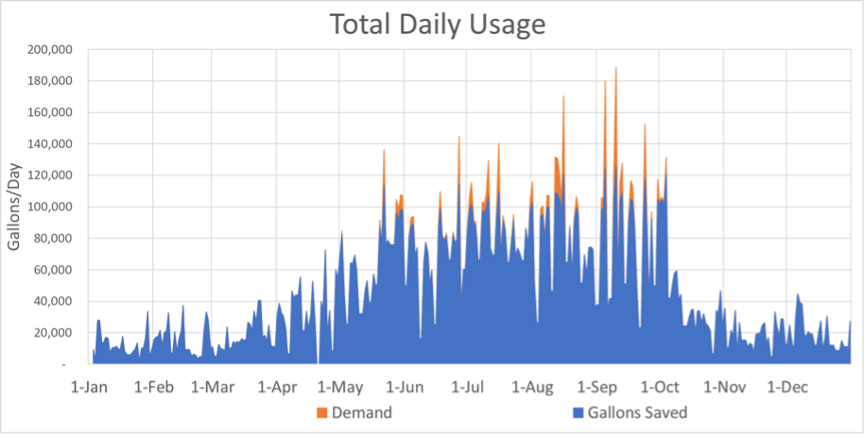
Figure 2. Estimated total daily cooling tower water supply and demand across all three buildings in 2019. The orange peaks represent days during which city water must be used to supplement ground water.
The use of monthly water utility bill data helped to determine project feasibility and communicate results to the client. It allowed for the calibration of the energy model, predicting cooling tower make-up water requirements on an hourly basis. The supply model was compared to the water demand model to determine how many gallons would be saved. Based on this analysis, a system could be designed and sized to reduce city water use by 90%. For these reasons, a client’s utility bills are the first place we go when beginning a retrofit analysis. A side-by-side comparison with detailed simulations allows for quality assurance and what-if analysis. Using these tools together, we can help clients save money, water, and energy.

Energy Engineer, 2RS Consulting LLC
Jobe earned his M.Eng. in Mechanical Engineering from the University of Louisville in 2022. During his education, he worked as a design engineer for Midea America Corporation, where he earned a patent for his work on pressure cookers. While earning his graduate degree, he also assisted research on a selective laser melting that is now published. At 2RS Consulting, Jobe compiles and analyzes historical utility data to recommend design criteria for commercial buildings around the country. He is also at the forefront of their research of decarbonization.
Robert R. Somers II, PhD, P.E.
President, 2RS Consulting, LLC
Mr. Somers has worked in the thermal sciences with an emphasis on analysis and implementation of carbon reduction/energy efficiency opportunities for 48 years. He was the director of the Center for Energy Analysis at the University of Virginia, providing technical support to the Virginia Division of Energy for more than 15 years. Since 1985 he has headed the energy consulting group now known as 2RS Consulting, providing clients throughout the United States and worldwide with de-carbonization planning, energy audits, computational analysis, design, commissioning, and measurement & verification of energy reduction measures.